Dates in SpreadsheetML
One of the most overlooked parts of dealing with OpenXML and SpreadsheetML in particular is handling dates in a spreadsheet. You can find tons of tutorials and articles evolving around charts, pivot-tabled and formulas, but they tend not to include date handling in their examples.
This article aims to fill that hole (and please let me know at the bottom if I didn’t reach that goal).
This article covers these perspectives:
- What are serial dates?
- What is a “date” in SpreadsheetML?
- How do I use them in a spreadsheet with a chart?
What are serial dates?
A “serial date” is simply a date represented as a number. “Serial dates” are also called “Julian dates” (not to be confused with the Julian Calendar itself) and are simply just a number. The number represents the number of days (and fractions thereof) since some predefined point in time. This point in time is called an “epoc“.
When it comes to OpenXml, two epocs are used:
- The 1900 backward compatibility date system
- The 1904 date system
The 1900 backwards compatibility date system has an epoc of December 31st 1899 at 00:00:00 . This particular point in time has a value of 0. So a serial date value of 25.50 is January 24th 1900 12:00:00 (at noon).
(Please note that in order to calculate dates correctly, the year 1900 must be considered a leap-year hence February 29th is considered a valid date – even though the year 1900 is not a leap year. This bug originated from Lotus 123, and was purposely implemented in Excel for backward compatibility.)
The 1904 date system has an epoc of January 1st 1904. This particular point in time has a value of 0.
So in conclusion – serial dates are simply numeric representations of points on time. To evaluate two serial dates against each other the date base must also be common hence the need for the epoc.
For the intrinsic details of how this all plays together, please consult the ISO standard for OOXML ISO/IEC 29500:2011, Part 1, Section 18.17.4 “Dates and times”. It is available on ISO download page.
What is a “date” in SpreadsheetML?
As you might have guessed by now, dates in Spreadsheets are “just” numbers specified with a particular epoc.
If you consult the XML-markup of a SpreadsheetML document containing a date cell (as generated by e.g. Microsoft Office), you will likely see something like this:
    <row r="1">
      <c r="A1" s="1">
        <v>40957</v>
      </c>
    </row>
This is not “just” the number 40957 – it is actually a date representing 2012-03-18 (my current local time). The key to deducting this it the ‘s’-attribute of the <c> element. The value 1 is a key (zero-based index) into the collection of styles located in the styles part of the spreadshet (typically named styles.xml). In my spreadsheet I find this information (amongst other things) in the styles part (styles.xml):
  <cellXfs count="2">
    <xf numFmtId="0" fontId="0" fillId="0" borderId="0" xfId="0"/>
    <xf numFmtId="14" fontId="0" fillId="0" borderId="0" xfId="0" />
  </cellXfs>
(abbreviated slightly to enhance understanding)
The value 1 from before is the key into this collection – referencing the second of the <xf>-elements.
Now we are almost there. The relevant information of the <xf>-element is the value of the numFmtId attribute – here “14”. The format “14” is one in a list of predefined styles defined in SpreadsheetML. If you look in the specification (ISO/IEC 29500:2011 in Part 1, section 18.8.30 numfmt (Number Format), you will see this table:
| ID | Format code |
| 0 | General |
| 1 | 0 |
| 2 | 0.00 |
| 3 | #,##0 |
| 4 | #,##0.00 |
| 9 | 0% |
| 10 | 0.00% |
| 11 | 0.00E+00 |
| 12 | # ?/? |
| 13 | # ??/?? |
| 14 | mm-dd-yy |
| 15 | d-mmm-yy |
| 16 | d-mmm |
| 17 | mmm-yy |
| 18 | h:mm AM/PM |
| 19 | … |
| 20 | … |
| 21 | … |
| 22 | … |
| 37 | … |
| 38 | |
| 39 | |
| 40 | |
| 45 | |
| 46 | |
| 47 | |
| 48 | |
| 49 |
(abbreviated for easier readability)
So the magical number 14 is the format string “mm-dd-yy” – hence a date.
And what is the key point to take away from this? Well, “dates” and “times” are just numbers (doubles) formatted a specific way. The way to determine the specific data type is to deduct it from the format string shown above.
How do I use them in a spreadsheet with a chart?
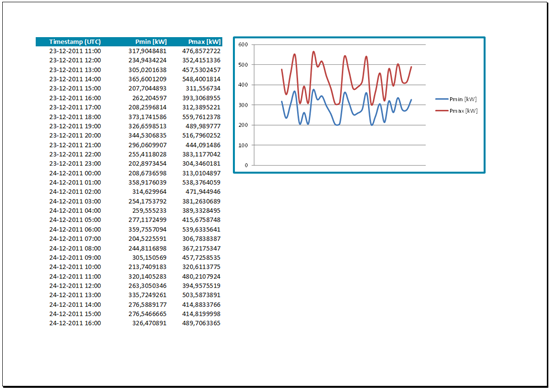
I took the tutorial “Document Assembly solution for SpreadsheetML” by Brian Jones & Zeyad Rajabi from back in 2008 and modified it slightly to incorporate usage of dates. The only real change I made was to create a function to create a Date cell. Also, I changed the chart type to a “Scatter chart” that allowed me to use a date/time column as Y axis (Excel does not support an DateTime axis with a resolution less than a day, and for this particular purpose, I needed a resolution of either 5 minutes or 1 hour.
So when running the code I get this result:
The key code is this, creating a Cell with a date in it:
        private static Cell CreateDateCell(string header, int index, DateTime time)
        {
            //Create new inline string cell
            var c = new Cell {CellReference = header + index, StyleIndex = 1};

            //Add text to text cell
            var value = new CellValue {Text = time.ToOADate().ToString()};

            c.AppendChild(value);

            return c;
        }
Notice that I am using the ToOADate()-method of the DateTime struct to convert from a DateTime instance to a serial date.
The rest of the code is available below:
    class Container
    {
        public double PMin;
        public DateTime TimeStamp;
        public double PMax;
    }

    class Program
    {
        static readonly string[] HeaderColumns = new[] { "A", "B", "C" };

        static void Main()
        {
            // Remember this when using the code in a Culture that doesn't use period (.) as decimal seperator
            Thread.CurrentThread.CurrentCulture = new CultureInfo("en-US");

            GenerateWorkbookFromDb();
        }

        static void GenerateWorkbookFromDb()
        {
            //Make a copy of the template file
            const string destinationFileName = "spreadsheet gen.xlsx";
            const string sourceFileName = "spreadsheet template.xlsx";
            File.Copy(sourceFileName, destinationFileName, true);

            //Open up the copied template workbook
            using (var myWorkbook = SpreadsheetDocument.Open(destinationFileName, true))
            {
                //Access the main Workbook part, which contains all references
                WorkbookPart workbookPart = myWorkbook.WorkbookPart;
                //Grab the first worksheet
                WorksheetPart worksheetPart = workbookPart.WorksheetParts.First();
                //SheetData will contain all the data
                var sheetData = worksheetPart.Worksheet.GetFirstChild<SheetData>();

                // could come from database or other data source
                var phList = StubbedDynamicList();

                var index = 2;

                    //For each row in my database add a row to my spreadsheeet
                    foreach (var item in phList)
                    {
                        //Add a new row
                        Row contentRow = CreateContentRow(index, item.PMin, item.PMax, item.TimeStamp);
                        index++;

                        //Append new row to sheet data
                        sheetData.AppendChild(contentRow);
                    }
                    worksheetPart.Worksheet.Save();
                    FixChartData(workbookPart, index - 1);
                }
            }

        private static IEnumerable<Container> StubbedDynamicList()
        {
            // This is just a dummy method to generate som test data

            var phList = new List<Container>();
            var random = new Random();
            for (var i = 0; i < 30; i++ )
            {
                var nextDouble = random.NextDouble();

                phList.Add(
                    new Container
                        {
                            PMin =  200 * (1 + nextDouble),
                            PMax = 300 * (1 + nextDouble),
                            TimeStamp = new DateTime(2011, 12, 23, 11, 0, 0).AddHours(i)
                        }
                    );
            }
            return phList;
        }

        static void FixChartData(WorkbookPart workbookPart, int totalCount)
        {
            var chartPart = workbookPart.WorksheetParts.First().DrawingsPart.ChartParts.First();

            //Change the ranges to accomodate for newly inserted data
            foreach (var formula in chartPart.ChartSpace.Descendants<Charts.Formula>())
            {
                if (!formula.Text.Contains("$2")) continue;
                var fragIndex = formula.Text.LastIndexOf('$');
                var fragment = formula.Text.Substring(0, fragIndex+1);

                formula.Text = fragment + totalCount;
            }
            chartPart.ChartSpace.Save();
        }

        static Row CreateContentRow(int index, double pMin, double pMax, DateTime time)
        {
            //Create new row
            var r = new Row {RowIndex = (UInt32) index};

            //First cell is a date cell, so create it and append it
            var firstDateCell = CreateDateCell(HeaderColumns[0], index, time);
            r.AppendChild(firstDateCell);

            //Create cells that contain data - here simple numbers
            for (var i=1; i<3; i++)
            {
                var c = new Cell {CellReference = HeaderColumns[i] + index};

                var v = new CellValue
                            {
                                Text = i == 1 ? pMin.ToString() : pMax.ToString()
                            };

                c.AppendChild(v);
                r.AppendChild(c);
            }
            return r;
        }

        private static Cell CreateDateCell(string header, int index, DateTime time)
        {
            //Create new inline string cell
            var c = new Cell {CellReference = header + index, StyleIndex = 1};

            //Add text to text cell
            var value = new CellValue {Text = time.ToOADate().ToString()};

            c.AppendChild(value);

            return c;
        }
    }
(a note on the template file: I have simply created a spreadsheet in Excel 2010 with some date in it and a chart displaying it – and the code above just manipulated the underlying data and chart)