How to add a jquery chart to an openxml word doc?
Home › Forums › Open-Xml-Sdk › How to add a jquery chart to an openxml word doc?
Tagged: drawingml, openxml, салат из крабов
This topic contains 40 replies, has 4 voices, and was last updated by rogersb 7 years, 8 months ago.
-
AuthorPosts
-
March 18, 2016 at 9:18 pm #2857
  C.NumericValue nv1 = nc.Elements<C.NumericValue>().ElementAt(1)
                                        .Elements<C.NumericValue>().FirstOrDefault();
now it faults out, specified argument was out of the range of valid values.\r\nParameter name: index
i found the chart, but it will not get past this. dont know why
March 21, 2016 at 1:41 pm #3221worked on this over the weekend on another platform, still couldnt make it work.
today, looking at the values with the mouse-over when its stopped at the above line, nc.Elements< the ‘nc’ has all the details of the chart, the results item? has the 3 series’ of data there.
just not getting how this works. tried referencing elements 0 – 3 all get an out of bounds exception
March 21, 2016 at 3:17 pm #3222HI Eric
can you please suggest alternative approaches to putting the chart onto the word doc? it seems like a kludge to have some script to make an image of the finished chart in jquery then save it and post the image into a word doc, but this trying to modify the chart vars is a brick wall, time is a big factor, needed to be working by noon today.
just to make sure, is it true that a chart does NOT work like a table in that i used the open xml sdk productivity tool 2.5 to view source and reproduced the table, in a few thousand lines of code, which was no problem; no matter what is done, such as comment out the numericvalue nv1 part and write it anyway? word says the file is corrupt
March 21, 2016 at 5:32 pm #3223ok i just found the code on your website, the ChartUpdater… wish i knew of that before but sometimes jump in and try to grind out code. I had copied/transcribed all the code from watching and pausing the youtube video
so by modifying this to point to my .docx and putting a content control around the chart it found it and modified the contents by magic. so now onto a new phase of trying to make this work
March 21, 2016 at 6:44 pm #3224Something is blocking any changes from happening in the chart. its been modified by the ChartUpdate.cs and it replaced the series names and all. But clicking on Edit? has no effect on anything, and it seems to have removed the content control; its no longer there. I named it Chart1 and the software found and updated it.
Now the chart cant be changed. The software changed the series names, and they cannot be changed back. It put 4 bars with 3 series. No, there has to be 3 bars and 2 series. Was trying to comment out where the code changes those names…
March 21, 2016 at 7:53 pm #3225Wrapping the chart with a rich text context control, even saying “Content Control CAN NOT BE DELETED” it deletes it anyway.
So far you get 1 use of the template then have to go back and add the content control each time its used
March 21, 2016 at 9:19 pm #3226Can you please help me figure out how to direct UpdateChart to point to the chart some other way? Such as directly after some string literal on the document so that the template can be re-used?
the chart rid is rId5. i have tried numerous ways to add a string literal @chartHere and have it use the next slot, which worked for the tables, not this.
content controls get obliterated each use
March 22, 2016 at 12:47 am #3228Hi Roger,
In your code, you find the first paragraph in the document, putting it into ppp.
The code following that which looks for descendants
will only find the chart if it exists in the first paragraph, which is why you are not finding it. -Eric
March 22, 2016 at 1:09 am #3229Hi Eric
The problem now is dealing with the content control being deleted by code in your (most excellent) code example called Chartupdater. I downloaded that project that modifies multiple word doc’s using a dos console appI modified the code to find my one word doc, I added the chart, colored it, labelled the series and all that, figured out how to set the data, all done right? no. I surround the chart with the content control and set the option DO NOT DELETE the content control, I think these CC’s have flaws but the code deletes the content control, so it is a one-use application.
In order to ‘see’ the chart, even though I know the rid is rId5, i put it in a content control and name it Chart1, zip bang it works and modifies the docx and saves it. But it can only be done one time
How can I modify the code so that the chart values can be changed as many times as needed? I think if I could find the chart without having to id the content control, then ‘replace’ it;
But i switched mid stream here, I was using the code from your youtube video that i transcribed, but then this project from your site almost works. zaps the content control and after that the data values do not get updated. Can you tell me a scheme to put a tag or ? to find where the chart is? or how to use the cc without erasing it?
March 22, 2016 at 1:58 am #3230this is the project Im now using
March 22, 2016 at 1:16 pm #3234public static bool UpdateChart(WordprocessingDocument wDoc, string contentControlTag, ChartData chartData) { var mainDocumentPart = wDoc.MainDocumentPart; var mdXDoc = mainDocumentPart.GetXDocument(); var cc = mdXDoc.Descendants (W.sdt) .LastOrDefault(sdt => (string)sdt.Elements(W.sdtPr).Elements(W.tag).Attributes(W.val).FirstOrDefault() == contentControlTag); if (cc != null) { var chartRid = "rId5";// (string)cc.Descendants(C.chart).Attributes(R.id).FirstOrDefault(); if (chartRid != null) { ChartPart chartPart = (ChartPart)mainDocumentPart.GetPartById(chartRid); UpdateChart(chartPart, chartData); var newContent = cc.Elements(W.sdtContent).Elements().Select(e => new XElement(e)); // cc.AddAfterSelf(newContent) cc.ReplaceWith(newContent); mainDocumentPart.PutXDocument(); return true; } } return false; }here where it says cc.ReplaceWith() the content control is removed from the word doc. Is there some way to set this up so the doc can be used more than once?
ok, perhaps if i could save the file with a different name than what it had and not write over the original…
March 22, 2016 at 6:28 pm #3239update:
I added the code to my web based app. It references a word.docx as a template but then saves the file back to the user with a saveAs, or save to /Downloads/ folderproblem:
now it smears the color of the barchart. Template: its a horizontal 0-100%, the used part is green, the unused is light gray, the used part has the value, unused is blank.Actual result: both unused and used are the same green color, both sides have the % value written in
Why is the formatting smearing like this? it was enough struggle to make it get this far in the chart updater.cs it did not step on the formatting
Any ideas on how to preserve the formatting of the color and similar settings?
March 22, 2016 at 7:55 pm #3240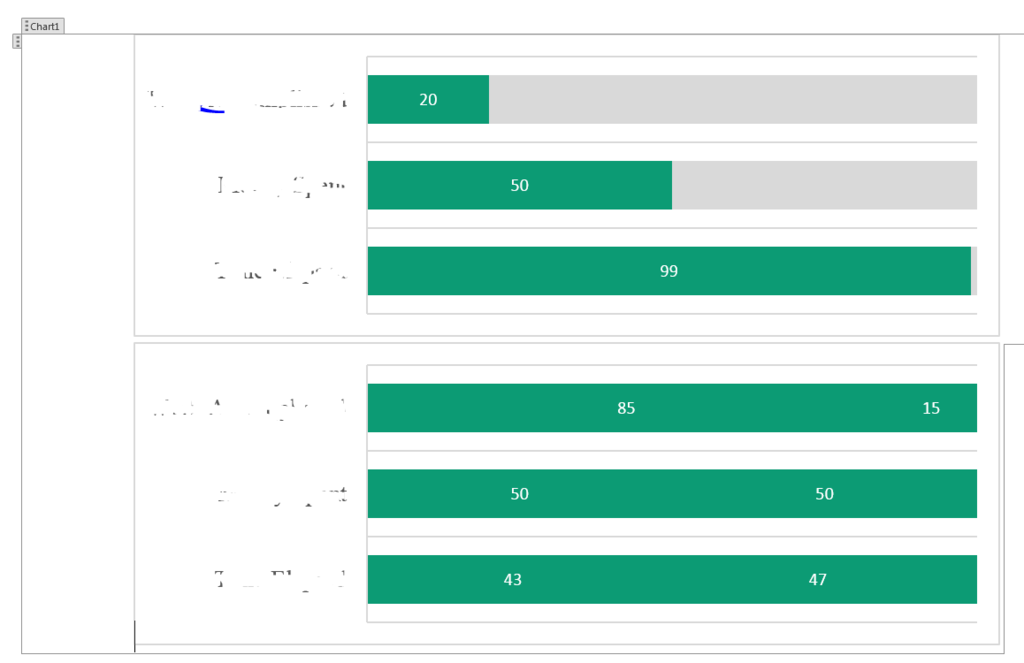
Any help is GREATLY appreciated!
how can I get the code to leave the formatting alone? When using the chartupdater.cs by itself it did seem to use what was there, it just obliterated the content control making it a one time use. now that i save the modified byte[] to a document then download to the user? it steps on the formatting
the ALL Green one is wrong. The values are different but the problem is the formatting, it should have a green area for used, and the series names were removed because they cannot be edited after the code writes them.
what is needed to preserve the coloring and shading? or how to manually enter it????
this is very much overdue now,
thanksMarch 23, 2016 at 5:29 pm #3254The problem now is that the formatting is being stepped on. If I set the template .docx chart to have BLACK font? it gets re-written with BLUE font. If the font is set to WHITE? its re written to BLUE.
if I make changes in the document and styling? they are ignored. but what does it matter
March 24, 2016 at 12:28 am #3259Hi Roger,
Unfortunately, I don’t have enough information from your description to understand where the problem is. PresentationML (and DrawingML) are pretty complex in the way that they inherit properties throughout the object graph, so I suspect you are affecting the object graph in some undesired way. But unfortunately, given current schedules, I don’t have time to debug the specific problem.
I suggest that you take the approach you mentioned, which is to always start with a presentation that contains the CC, and to not attempt to replace the data for a chart more than once. Once you generate a presentation/chart with the correct data, you can include it in another document using the DocumentBuilder module.
Cheers, Eric
-
AuthorPosts
You must be logged in to reply to this topic.